You’re handed the Korean-language section of Korea’s CSAT — the College Scholastic Ability Test, the single national exam that roughly half a million students sit on the same day every November, with outsized power over what happens to them next. Pages turn around you. The timer’s already running. You read passage one and nothing lands. Passage two, same thing. Passage three, same thing. So you imagine the worst case: shutting your eyes and marking bubbles 1 through 45 at random on the OMR sheet (Korea’s version of a Scantron bubble sheet). What score does that actually produce?
Everyone already knows the standard answer: “five choices per question, so somewhere around 20 points.” Correct — the expected value works out to exactly 20. But push one step further and ask “so how hard is it to ace this thing on luck alone,” and the story turns strange. The probability of missing every single question (0 points) and the probability of landing near-perfect (47 or above) turn out to sit in the same statistical neighborhood — both roughly 1-in-23,000. And chasing down the real reason a perfect score is so hard peels back in layers. The first answer is that it’s not about difficulty at all, it’s about the sheer number of questions. Then that answer gets knocked down too, once real-world data enters the picture.
Why this exam, and not the SAT
A fair question if you’ve never sat the CSAT: why run this calculation on a Korean exam rather than one you’ve actually taken?
Because on most of the exams you’ve taken, the question is unanswerable. On the SAT, the ACT, and the TOEIC, the number of questions you get right is not your score. Each of those tests runs your raw correct-answer count through an equating table that compensates for how hard that particular test form turned out to be — and those tables are built fresh for every administration and are not published. ETS states outright that raw scores are never reported to TOEIC test takers.[20] So “what would I score if I guessed on everything” has no fixed answer for those exams. It depends on a conversion table nobody outside the testing organization can see.
The CSAT has no such layer. Each question carries a stated point value, the values add up to 100, and that sum is the score that goes on your report. Add the points, and you’re done. That makes it one of the few high-stakes exams on earth where this question has an exact answer rather than an estimate — which is the entire reason it’s the worked example here.
The parts of this that do transfer to your exam are the ones that need only two numbers: how many questions, and how many choices each. Those are the odds of a perfect score, and they show up later with the ACT and TOEIC run through the same formula.
INPUT
Let’s pin down the assumptions first. Every number below comes with a source, and a note on whether it leans conservative or aggressive.
The structure of the Korean-language section is 45 questions total — 35 worth 2 points and 10 worth 3 points — adding up to a 100-point scale. Every question is five-choice multiple choice.[1] If you’re guessing purely at random, the odds of getting any one question right are . This structure comes straight from the exam authority’s own published spec, so it’s safe to take as fixed rather than estimated.
The English section uses the identical skeleton: 45 questions, the same 2-point×35 + 3-point×10 structure totaling 100, also five-choice.[1][2] The one difference: English has used absolute grading since 2018, meaning a raw score slots into a pre-set grade band (1 through 9) rather than being curved against everyone else that year.
Math has just 30 questions — fewer than either language section. It splits into 21 multiple-choice questions (3 worth 2 points + 10 worth 3 points + 8 worth 4 points = 68 points) and 9 short-answer questions (4 worth 3 points + 5 worth 4 points = 32 points). This point breakdown comes from cross-checking the official answer-and-scoring table KICE (the Korea Institute for Curriculum and Evaluation, the body that writes and grades the CSAT) releases right after the exam. Of the 22 common questions, 1–15 are multiple choice and 16–22 are short answer; of the 8 elective-track questions (Probability & Statistics / Calculus / Geometry — each student picks one track), 23–28 are multiple choice and 29–30 are short answer, and this exact point combination (down to how many 2-, 3-, and 4-point items there are) checks out.[3][4] The short-answer questions require typing in a three-digit number from 000 to 999, so the odds of guessing one correctly are just 1/1000.[5]
Real-world perfect-score statistics for the Korean-language section go into the model too. On the 2025 CSAT, 1,055 of 461,252 test-takers scored a perfect 100 (0.229%).[6] On the 2026 CSAT, only 261 of 490,989 test-takers did (0.053%).[7][8] Both numbers get used later to show exactly how optimistically wrong a “uniform knowledge” model turns out to be. Both are official scoring results KICE published directly, so they can be taken at face value.
Finally, one modeling variable: the “confidently-known fraction” . This is a simplified model where a fraction of questions are answered correctly on pure knowledge, and the remaining are pure random guesses. is a total-guess run; is a perfect scorer. Flagging this upfront: isn’t a measured value — it’s a modeling assumption that gets disproven later in this piece.
FORMULA
The Full-Guess Score Distribution — An Exact Calculation
The Korean-language score is determined by the combination of , the number correct among the 35 two-point questions, and , the number correct among the 10 three-point questions. Guessing purely at random gives each question a chance of being right, so and each follow a binomial distribution (the probability distribution for the number of successes across a fixed number of independent trials).
Every probability in this piece is an exact analytical value, obtained by convolving (combining two probability distributions to get the distribution of their sum) these two binomials at the level of individual integer scores. Nothing here is approximated or simulated — every figure was computed with exact fractional arithmetic down past the decimal point. Start with the mean and variance.
The variance needs care. Because 2-point and 3-point questions are mixed together, you can’t just reach for the textbook binomial-variance formula . Each question’s variance has to be weighted by the square of its point value before summing.
So: a mean of 20, a standard deviation of about 6.07. The rule of thumb “roughly 68% falls within ±1 standard deviation” is only exactly true for a symmetric continuous distribution (a normal, bell-shaped curve). The Korean-language score distribution is chunky (integer-only) and skewed, so adding up the actual probability across the 14–26 range (20±6.07, rounded) gives 71.46%, not 68%.[9] You can force something closer to 67% by cherry-picking an asymmetric window like [15, 26] or [14, 25], but that makes the interpretation messier than it’s worth — so this piece just reports the honest number: about 71% falls within ±1 standard deviation (14–26 points).
The Normal-Approximation Trap — Why It Doesn’t Work Here
Binomial distributions with a lot of trials, like this score distribution, are often approximated with a normal distribution (the symmetric, bell-shaped curve) for convenience — you can get an answer from a standard-normal table without a computer. Because you’re approximating a discrete distribution (one that only takes integer values) with a continuous one, this is usually paired with a “continuity correction.” For example, to find the probability that exceeds 40, you’d compute the normal probability using the cutoff 40.5, not 40.[10]
The problem: this distribution runs on , quite far from the symmetric baseline of 0.5. The farther drifts from 0.5, the more a binomial’s shape stretches into a long right-hand tail (toward the high scores). A normal distribution is symmetric by definition, so it systematically underestimates that right tail. Here’s how far off it actually gets:
| Condition | Exact value | Normal approximation (with continuity correction) | Error factor |
|---|---|---|---|
| Above 30 | 1.15× | ||
| Above 40 | 2.68× | ||
| Above 50 | 15.2× |
Near 30 points, a 15% error is tolerable. But push out to 4–5 standard deviations from the mean — into genuinely rare territory — and the error compounds exponentially. The normal approximation puts the probability of clearing 50 points at 15 times lower than it actually is. This piece is specifically about that kind of extreme tail probability — a perfect score, a zero, a near-miss at 47+ — so the normal approximation was never going to be a usable tool here. That’s why every number in this piece comes from computing the binomial exactly, at the level of individual integers. This same asymmetry is also the mathematical reason behind Twist 1, coming up next.
Twist 1 — Guessing’s Worst Case and Its Near-Best Case Land in the Same Ballpark
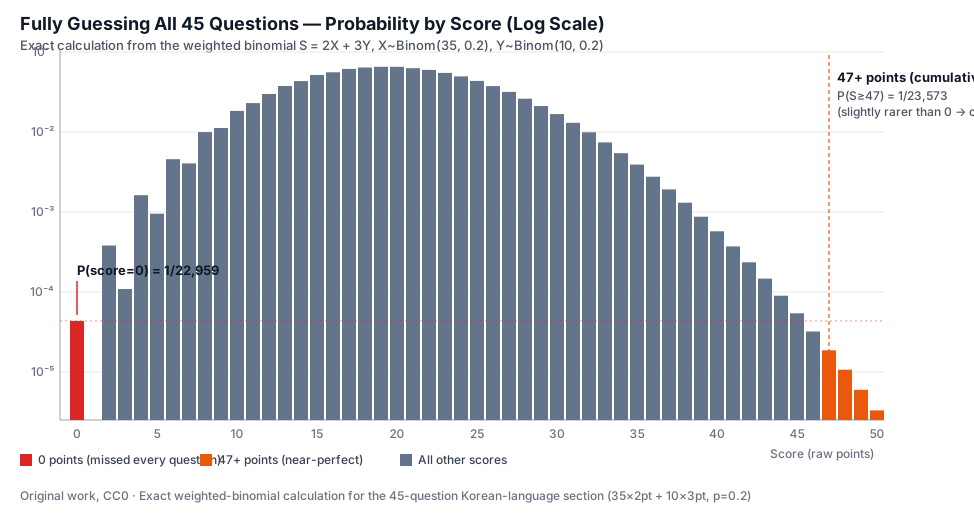
Now put both extremes side by side. The probability of missing every single question — a flat 0 — is:
As odds, that’s about 1-in-22,959.[11] So what about the opposite extreme — near-perfect, 47 points or above?
Line them up: 1-in-22,959 for a zero, 1-in-23,573 for 47-plus. The gap is 2.7%. Total, uncomprehending failure and a near-perfect run of luck land, statistically, on the exact same order of magnitude — both somewhere in the low tens of thousands. That balance is a knife’s edge, though. Shift the cutoff down by one point, to 46, and the ranking flips: 46-and-above becomes 1.71 times more common than a zero. The actual crossover sits somewhere between 46 and 47. The fact that this balance exists at all is itself a demonstration of just how long that right-hand tail from the earlier asymmetry really stretches.
Twist 2 — The Enemy of a Perfect Score Isn’t Difficulty, It’s Question Count (in the Pure-Guessing World)
Calculate the probability of a perfect score directly:
The digits alone don’t mean much. So convert it into time, under the assumption that “8 billion people each attempt one random guess-run per second.” World population passed 8 billion in 2022.[12] Compare four exams that differ only in how many questions they have.
| Exam | Structure | P(perfect) | Time needed, 8 billion people guessing once per second |
|---|---|---|---|
| A school midterm | 20 Q × 5 choices | 3.3 hours | |
| CSAT Korean/English | 45 Q × 5 choices | 8,158× the age of the universe (13.8 billion yr)[13] | |
| Enhanced ACT (core)[17][18] | 131 Q × 4 choices | × the age of the universe[13] | |
| TOEIC | 200 Q × 4 choices | × the number of atoms in the observable universe (~)[14] |
The question count only grew 2.25× (20 → 45), but the probability of a perfect score collapsed by roughly . Push into the 100-to-200-question range and things get stranger still: “N times the age of the universe” stops being a big enough ruler, and you have to re-anchor to the number of atoms in the observable universe just to write the exponent down. This is the point where the numbers stop meaning anything intuitive.
(A note for readers outside Korea: the same mechanism runs on your own exam — plug in the numbers and the collapse holds.) Take the ACT. Under the redesigned “Enhanced ACT” format that rolled out in 2025, the mandatory core is 131 questions — 50 English, 45 Math, 36 Reading — and every one of those sections now uses four answer choices; Math specifically dropped from five choices to four, folding into the same format as the rest of the test.[17][18] Run that through the identical formula: , roughly times less likely than acing the CSAT purely by guesswork. An 8-billion-strong army of simultaneous guessers, one attempt per second, would need about times the current age of the universe to produce a single lucky perfect run. The redesigned Digital SAT complicates the comparison a little: roughly a quarter of its Math section is made of grid-in numeric-entry questions with no fixed set of choices to guess among at all[19] — the same mechanism Korea’s own Math section uses with its short-answer questions, covered further down. Whichever test you actually sat, the takeaway is identical: it was never really about how hard any single question was.
Twist 3 — But the Real Culprit Is a Handful of Killer Questions (in the Skilled-Test-Taker World)
Stop here and you get a tidy conclusion: “question count is the culprit, case closed.” But that conclusion only holds at . Real perfect-scorers aren’t pure guessers — they’re skilled test-takers. To see what happens in that world, build a uniform-knowledge model using the “confidently-known fraction” defined earlier: on each question, the test-taker knows the answer outright with probability , and otherwise makes a pure 1-in-5 guess with probability . Per-question accuracy then becomes:
Run this model to get the perfect-score probability , and here’s what falls out:
| Per-question confidence | Probability of a perfect score |
|---|---|
| 90% | 2.35% |
| 95% | 15.93% |
| 99% | 69.67% |
| 98.089% (threshold) | Exactly 50.00% |
By this model, being confident on 98.089% of the material and shaky on the remaining 1.911% is already enough to push the odds of a perfect score above 50%. At 99% per-question confidence — missing roughly 1 question in 100 out of sheer uncertainty — the perfect-score probability climbs to a startling 69.7%. That sounds like a confidence level a strong student could plausibly reach.
Except plug in real data and the model gets flatly contradicted. The actual perfect-score rate on the 2025 CSAT was 0.229%, and 0.053% on the 2026 CSAT.[6][7][8] Compared to the model’s predicted 69.7%, the real rate is 304 to 1,314 times lower.
A gap this size cannot be waved away with “students are just a bit less confident than 99%.” A discrepancy over 300× means the model itself is built wrong. The uniform-knowledge model assumes all 45 questions are equally likely to be known, at the same rate . Real exams don’t work that way. Even top-tier students sit at near-100% confidence on most of the 45 questions. The trouble is the remaining three or four — the ones commonly called “killer questions” — deliberately brutal items where even elite test-takers’ confidence craters. A uniform- model flattens that unevenness into a single average, which is exactly why it wildly overestimates the odds of a perfect score. What decides a perfect score isn’t average skill across all 45 questions — it’s whether you survive the three or four hardest ones.
It’s worth pausing here, because Twist 2 and Twist 3 can look like they contradict each other. They don’t — they simply hold in different regimes. Twist 2 (“question count is the culprit”) is a mathematical fact that holds at , the pure-guessing world where question-to-question difficulty differences are meaningless by construction. Twist 3 (“killer questions are the culprit”) is an empirical fact that holds as approaches 1 — the skilled-test-taker world, where the further up the ability scale you go, the more the variance between individual questions’ difficulty comes to dominate. Both twists are the same exam viewed through two different lenses; neither one is wrong. For someone guessing blind, the wall standing between them and a perfect score is the question count itself. For someone who already knows the material cold, the wall is a small handful of specific questions.
Control Group — What About Math and English?
Math plays by different rules. The 9 short-answer questions (32 points) require guessing a specific number from 000 to 999 — a 1/1000 shot — so treating them as worth zero points on a guess run is a fine approximation. Computing the expected score off just the 68 points of multiple-choice material gives points; even folding the short-answer questions back in with the exact 1/1000 model only nudges the expected value to 13.632 points, a difference of 0.03.[15] The perfect-score probability tells a different story, though: those same 9 short-answer questions become a bottleneck, dropping the odds to — about 16.8 billion times rarer than the Korean-language section’s . A single gate made of fill-in-the-blank questions is enough to shut out a perfect score almost entirely.
English shares the Korean-language section’s exact point structure, so its guess-score distribution is identical too. Mapping that onto the absolute-grading bands: a fully-guessed run lands in grade 9 (0–19 points) 48.30% of the time and grade 8 (20–29 points) 45.21% of the time — grade 9 wins out by 3.1 percentage points. And roughly 1 in 15 test-takers (6.48%) would still land grade 7 or better.[16] The folk wisdom that “guessing everything splits about 50/50 between grade 8 and grade 9” turns out to be roughly right, but tilts slightly toward grade 9 once you do the precise math.
OUTPUT
Here are all three twists, stacked in order. Fully guess your way through the 45-question Korean-language section and the expected score is 20 points, with a standard deviation of roughly 6.07. And yet the probability of a zero (1-in-22,959) and the probability of 47-plus (1-in-23,573) land on the exact same order of magnitude — that’s Twist 1. The probability of a perfect score is ; 8 billion people guessing once a second would still need 8,158 times the current age of the universe to produce one. That grim probability has nothing to do with the section being hard — it’s purely a function of there being 45 questions — that’s Twist 2. Except the actual real-world perfect-score rate (0.053–0.229%) comes in over 300 times lower than what a naive model predicts (“99% per-question confidence gets you a 70% shot at a perfect score”). What actually decides a perfect score isn’t overall mastery across 45 questions — it’s a handful of killer questions — that’s Twist 3.
None of this is a strategy guide for guessing. It’s a demonstration of what the shape of a probability distribution actually looks like. There’s no reason to deliberately guess wrong on a question you actually know the answer to in a real exam room. But one thing is now clear. “I guessed everything and got 20” is a statistically unremarkable thing to say. “I guessed everything and got a zero” and “I guessed everything and scored 47-plus” are both, equally, 1-in-tens-of-thousands events — rare in exactly the same way. That the worst possible outcome and the near-best possible outcome stand shoulder to shoulder like that is, to me, the strangest and most satisfying conclusion in this whole exercise.
References
[1]: Edujin (에듀진), “[CSAT D-107] 2026학년도 수능 과목별 문항 유형 및 배점” (“[D-107 to the CSAT] 2026 CSAT question types and point values by subject”), https://www.edujin.co.kr/news/articleView.html?idxno=50439
[2]: Newsis (뉴시스), “평가원 ‘영어, 다양한 소재·지문 활용…EBS 간접연계’[2024수능]” (“KICE: ‘English section draws on varied topics and passages, with indirect EBS textbook linkage’ [2024 CSAT]”), https://www.newsis.com/view/NISX20231116_0002524619
[3]: 2026학년도 대학수학능력시험 수학 영역 정답표 (Official 2026 CSAT Math answer key, listing every question’s number, correct answer, and point value), https://files-scs.pstatic.net/2025/11/13/Feww0tP2uy/2026수능수학정답.pdf (A press-redistributed copy of the answer key KICE, Korea’s exam authority, releases on exam day. Cross-checking point values question by question confirms that questions 1–15 and 23–28 (21 questions) are multiple choice worth 68 points, and questions 16–22 and 29–30 (9 questions) are short answer worth 32 points. The 2-, 3-, and 4-point question counts, 2×3+3×10+4×8=68 and 3×4+4×5=32, check out at the individual-question level.)
[4]: Edusherpa blog (에듀셀파 독학기숙학원 블로그), “2025 수능수학 배점을 생각하며” (“Thinking through the 2025 CSAT Math point structure”), https://blog.edusherpa.kr/blog/study/2024/7/30/90/ and Namu Wiki (나무위키), “대학수학능력시험/수학 영역/여담” (“CSAT / Math Section / trivia”), https://namu.wiki/w/대학수학능력시험/수학 영역/여담 (A secondary cross-check confirming the same point structure held for the 2025 exam year. Read alongside [3], this shows the structure is stable across exam years rather than a one-off.)
[5]: busanhaps.com, “수능 시험 과목 구성과 채점 방식 완전 분석 2025” (“A complete breakdown of CSAT subject structure and scoring, 2025”), https://busanhaps.com/society/suneung-subjects-scoring-system-analysis/
[6]: Asia Economy (아시아경제), “‘2025 수능’ 국어·수학 모두 표준점수 최고점 하락…전과목 만점자 11명” (“‘2025 CSAT’: top standard scores fall in both Korean and Math; 11 students score a perfect all-subject total”), https://www.asiae.co.kr/article/2024120511552728843 (Cites KICE’s official scoring-results briefing. The article body states 1,055 perfect scorers on the Korean-language section, out of 461,252 test-takers. The headline figure of “11 perfect scorers” refers to students who aced every subject on the exam — a different, much smaller number than the 1,055 single-section Korean perfect scorers cited in the body text.)
[7]: Korea Policy Briefing (대한민국 정책브리핑), “2026학년도 대학수학능력시험 채점 결과 발표” (“2026 CSAT scoring results announcement”), https://www.korea.kr/briefing/policyBriefingView.do?newsId=156733254
[8]: Jeonmae Ilbo (전매일보), “2026학년도 수능, 영어·국어 모두 ‘역대급 불수능’…만점자는 5명뿐” (“2026 CSAT: both English and Korean hit record difficulty — only 5 students score perfect across the board”), https://www.jeonmae.co.kr/news/articleView.html?idxno=1208981 (Cites KICE’s scoring-results briefing. The body text states 261 perfect scorers on the Korean-language section; the headline’s “5 students” refers to all-subject perfect scorers, distinct from the 261 single-section Korean perfect scorers cited in the body.)
[9]: Author’s calculation (exact convolution, using fractional arithmetic, of the weighted binomial , , ), derived from the Korean-language section’s structure ([1]) and the 1-in-5 guessing probability.
[10]: Imperial College London, HELM Workbook 39.2, “The Normal Approximation to the Binomial Distribution,” https://nucinkis-lab.cc.ic.ac.uk/HELM/workbooks/workbook_39/39_2_norm_approx_bin.pdf
[11]: Author’s calculation (same method as [9]). .
[12]: UN, “World population to reach 8 billion on 15 November 2022,” https://www.un.org/en/desa/world-population-reach-8-billion-15-november-2022
[13]: NASA JPL, “Planck Mission Brings Universe Into Sharp Focus” (age of the universe: 13.8 billion years), https://www.jpl.nasa.gov/news/planck-mission-brings-universe-into-sharp-focus/
[14]: Universe Today, “How Many Atoms Are There in the Universe?” (roughly 10⁸⁰ atoms in the observable universe), https://www.universetoday.com/articles/atoms-in-the-universe
[15]: Author’s calculation, based on the Math section’s point structure ([3][4]) and short-answer answer range ([5]).
[16]: Author’s calculation (applying the distribution from [9] to English’s absolute-grading boundaries: 0–19 / 20–29 / 30+).
[17]: ACT, Inc., official test-format page, https://www.act.org/content/act/en/products-and-services/the-act.html (Confirms the Enhanced ACT’s mandatory core: English 50 questions/35 min, Math 45 questions/50 min, Reading 36 questions/40 min — 131 questions total — with Science as a 40-question optional add-on.)
[18]: ACT, Inc., official counselor blog, “The Enhanced ACT Explained,” https://counselorblog.act.org/the-enhanced-act-explained (Confirms the Enhanced ACT’s Math section moved from five answer choices to four, “matching the other sections” — English and Reading have long used four-option multiple choice.)
[19]: College Board, official SAT Suite page, “Student-Produced Responses,” https://satsuite.collegeboard.org/sat/whats-on-the-test/math/student-produced (Confirms roughly 75% of Digital SAT Math questions are 4-option multiple choice and roughly 25% are student-produced response/grid-in questions, with no fixed set of choices to guess among.)
[20]: ETS, TOEIC Listening and Reading Test Examinee Handbook, https://www.ets.org/pdfs/toeic/toeic-listening-reading-test-examinee-handbook.pdf — ETS states that raw scores are not reported to test takers and that a separate raw-to-scaled conversion table is produced for each test form, so the same number of correct answers can map to different scaled scores across administrations. The SAT and ACT use the same equating approach.